The $6,233 Insight Hiding in Your Customer Data — That Could Reshape Your Growth Strategy
Get clarity on your highest-value customers, best campaigns, and real LTV:CAC ratio — in one simple diagnostic.
Limited capacity available — we run these one-on-one.
The Problem
Most operators don't realize there's a $6,000+ difference between their best and worst customers — and even if they do, they don't know how to spot it, track it, or act on it.
You're probably looking at average revenue per job, maybe revenue by campaign inside ServiceTitan. But that barely scratches the surface:
- You don't see how customer value grows over time
- You don't know which cohorts expand or stall
- You can't tie specific spend to actual lifetime value
Instead, you're flying blind:
- Guessing on CAC using industry benchmarks or % of job revenue
- Setting CPAs based on what "feels right," not what a customer is really worth
- Under-investing in campaigns that quietly create $12K+ customers — while overvaluing low-LTV leads
This isn't just a tracking problem. It's a strategy problem.
And it's costing you scale.
Then the real pain hits:
Next month, call counts are down, and you're worried you can't keep all the technician hires you fought, bled, and paid to get. You don't have enough volume and you're scrambling to understand why.
Is it the economy? The weather? Whether an orange or blue man or someone who doesn't know the difference is in office?
It's a perpetual cycle. You end up pushing too hard on your CSRs, expecting the call team to work miracles. You're buying massages or bingo tickets to call your customers even harder, offering discounts, promotions, and even free kitchen sink installs to close deals because volume is down and you're desperate to make your budget.
Because in reality:
- Your best customers take time to convert — and are worth the wait
- Some campaigns need nurturing, not canceling
- And until you know exactly who turns into what, you're optimizing in the dark
The real problem isn't bad leads — it's uncalculated upside.
What This Looks Like
Here's how this usually plays out:
Guessing ➝ Bad Budget ➝ Stalled Growth
📉 "We'll spend 8% of revenue on ads."
📉 "Our CPA should be $200 because our average job is $2,500."
📉 "This campaign looks weak — turn it off."
But in reality:
- Some $200 CPAs turn into $12,000 customers
- Some $75 CPAs lead to dead-end one-offs
- You can't spot this without cohort tracking
This is the gap the LTV X-Ray solves.
It's not another attribution tool — it's a lens into the actual growth behavior of your customers.
We show you:
- Which leads are truly high value — and why
- What campaigns create long-term customers
- Where to double down, cut losses, or adjust strategy
Introducing LTV X-Ray
A powerful diagnostic tool that reveals the true value of your customer acquisition efforts.
What You Get
The LTV X-Ray includes everything you need to confidently grow smarter, not harder:
- Cohorted LTV by acquisition month
- Grouped by campaign, service line, job type, and more
- Clear time-to-value and revenue ramp insights
- Integrated from connected spend sources (Meta, Google, Mailers, etc.)
- Tracked against each customer cohort
- Live CAC-to-LTV ratio calculations per source
- Discover undervalued campaigns that drive outsized results
- See exactly where you're underspending relative to LTV potential
- Identify $5K+ per customer gaps in value
- The top 3–5 actions we recommend to scale profitably
- What to do now, next, and avoid
- Written in plain English, not data jargon
- One full year of interactive dashboard access
- Bi-weekly (fortnightly) scorecard calls with marketing & BI experts
- 30-60-90 day action plan with guided implementation
- Exactly what campaigns to cut immediately
- Where you should spend 10x more for maximum ROI
- Clear agency directives (or when to consider replacing them)
Real Example: What We Found in Just One Client's Data
One of our clients — a high-performing service business using ServiceTitan — had no idea how massive the value gap was between their campaigns.
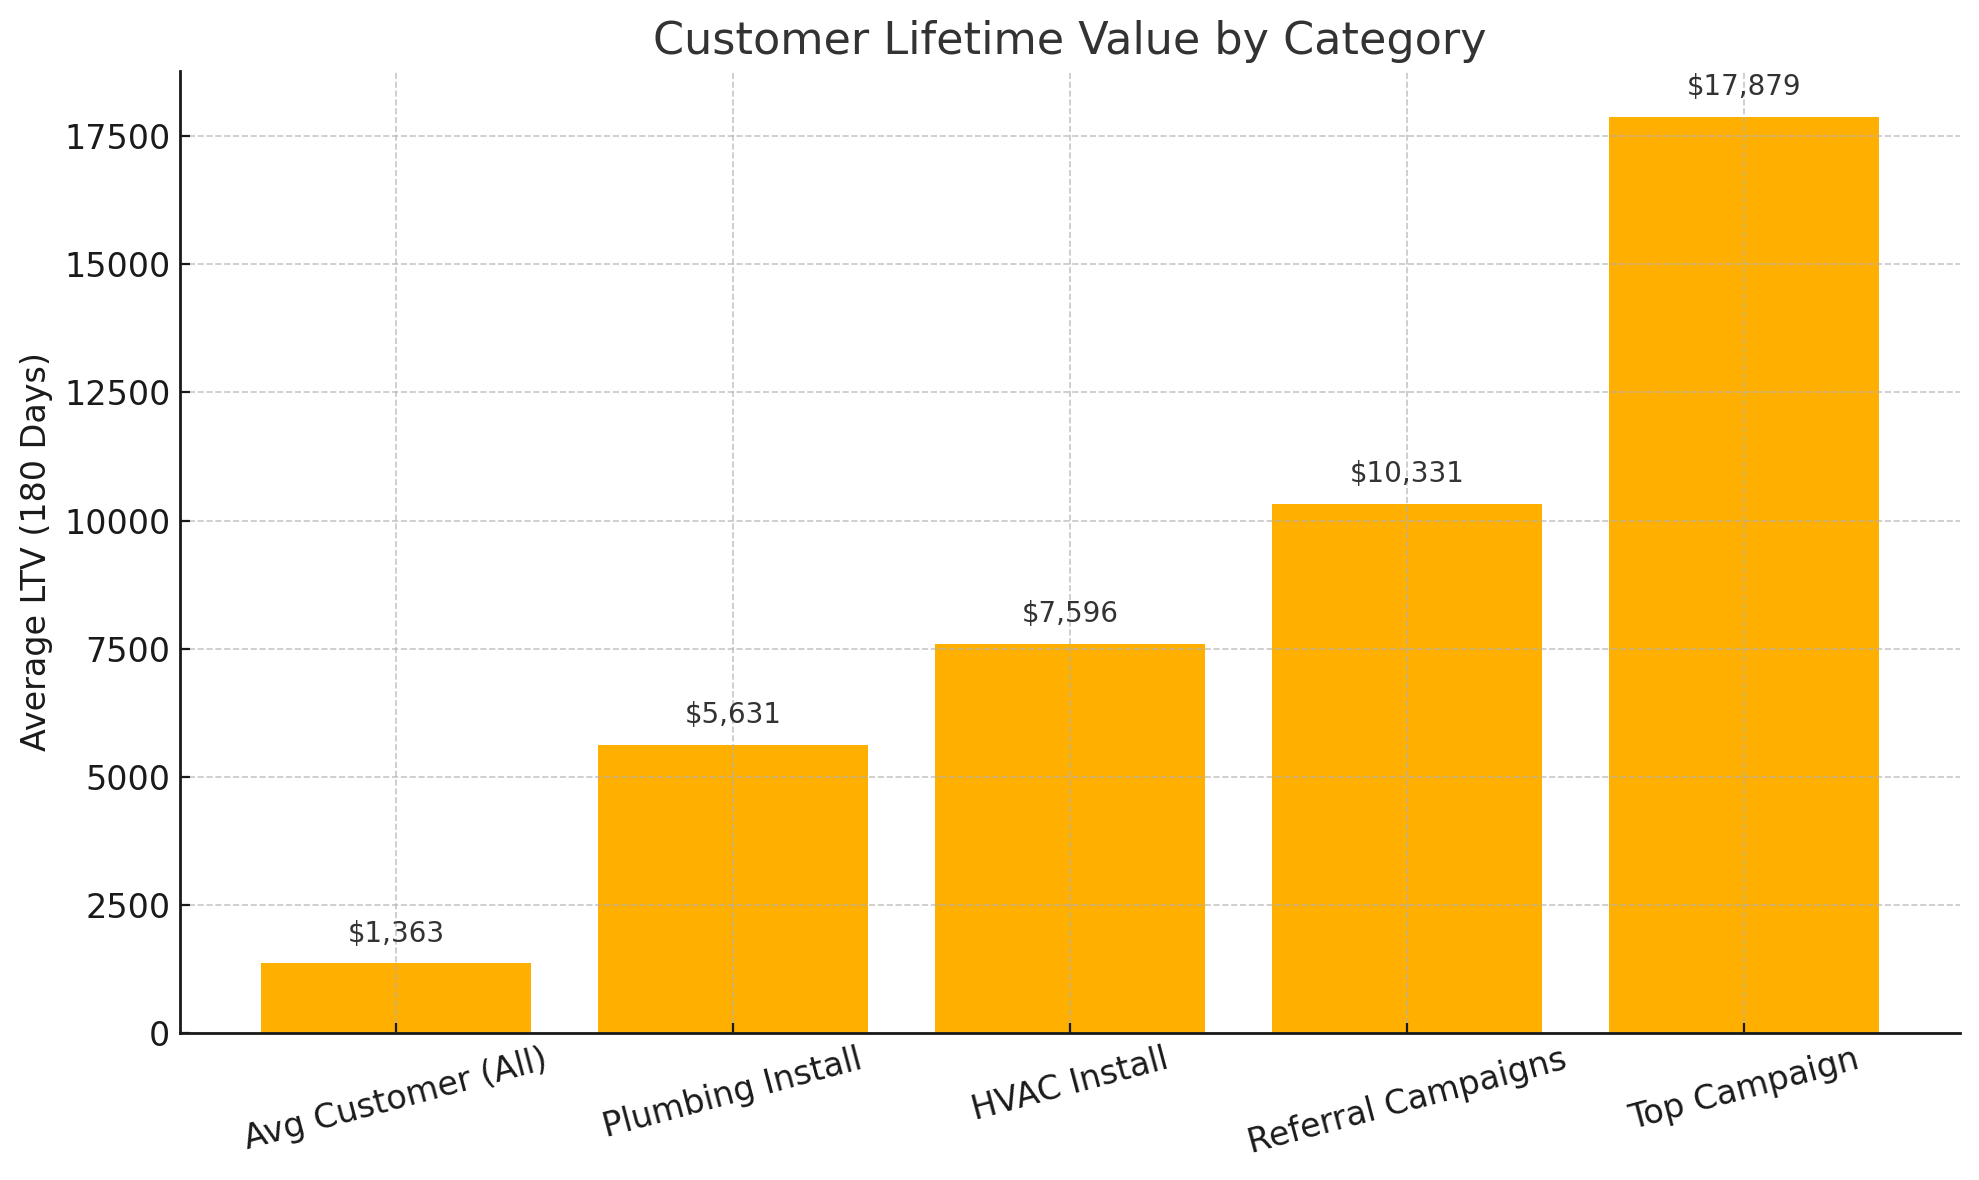
When we ran their LTV X-Ray, we focused on the first 180 days of customer value and found:
180-Day Customer Value Analysis
This revealed a clear pattern: entry point and job type significantly affect long-term value. Even among "high-value" categories like installs, there was a 35% difference in average LTV between HVAC and plumbing. And within HVAC, some campaigns produced nearly 3x the customer value of others.
These insights reshaped how the client thought about campaign targeting, offer prioritization, and ad spend. Instead of chasing volume, they started prioritizing cohort quality.
180-Day Average LTV by Source
"The LTV difference on members is crazy. That flipped a switch for me."
Why It Works
Built for ServiceTitan
Exclusively for ServiceTitan users doing $10M+ in annual revenue
Proven Results
Already tested and proven with high-growth operators
Fast Turnaround
Usually <8 hours once data syncs
No Commitment
No ongoing commitment required
Frequently Asked Questions
Who This Is Perfect For
Home services companies
Using ServiceTitan as their core platform
$3M+ annual revenue
With established customer base and data
Running paid media
Meta, Google, Mailers, and other channels
Want clarity on spend
Efficiency and customer value insights
If you're tired of guessing, clicking around in half-built dashboards, or wondering what your customers are really worth...
This is for you.
Ready to See the Value Hiding in Your Customer Base?
Book your LTV X-Ray now.
Limited capacity available — we run these one-on-one.